|
|
|
|
 |
| ECONOMIC PERFORMANCE |
| |
| Key Highlights |
| |
|
|
|
PARTICULARS |
FY 2008 - 09 |
FY 2009 - 10 |
|
Revenues of companies |
231,028.30 |
299,131.50 |
|
Net turnover |
110,440.70 |
127,545.60 |
|
Profit after tax |
21,315.50 |
32,100.70 |
|
Foreign exchange earnings* |
6,912.50 |
7,614.40 |
|
Amount spent on R&D* |
5,156.50 |
6,648.60 |
|
|
 |
|
 |
*For M&M Lmited only
The values of revenues, Net Turnover and Profit After Tax are on
standalone basis and before elimination of intergroup transactions |
|
Note: The above comparison should be viewed
in the light of the fact that MTWL has been added to
the scope in 2009-10. |
|
 |
|
| |
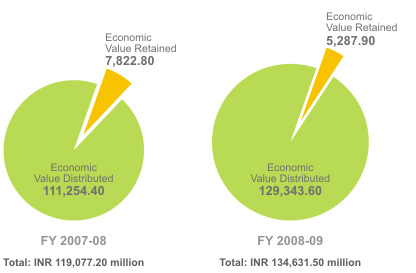
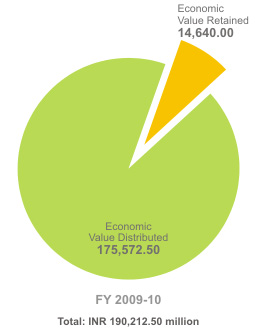
| Direct economic value generated (revenues) |
| INR Million |
 |
|
 |
|
| The economic value retained for M&M, Limited. is calculated as economic value generated less economic value distributed and represented in INR (million). |
 |
|
| Financial Assistance received from the government |
INR million |
|
| |
|
| |
| |
|
| |
|