|
|
|
|
 |
| ENVIRONMENTAL PERFORMANCE |
| |
| Environmental Management |
| |
| Greenhouse Gases |
| |
 |
Emissions come from several sources. Carbon dioxide, methane and nitrous oxide are emitted when we burn fossil fuel and bio-fuel as sources of direct energy |
|
|
 |
Emissions that result from the generation of the electricity, heat or steam a company purchases. |
|
|
 |
Apart from these major sources, a considerable amount of GHG emissions come from travel, commuting, shipping and receiving supplies. |
|
|
| Moving forward towards our goal of comprehensive and detailed reporting, from this year we have commenced reporting our Scope 3 emissions and the location-wise carbon footprint of each sector. |
|
| At Mahindra, we follow the GHG protocol and use the WBCSD/WRI tool for GHG calculation for Scope-1 & Scope-2 emissions. |
|
|
| We follow the GHG protocol and use the WBCSD/WRI tool for GHG calculation for Scope-1 & Scope-2 emissions. |
| |
 |
|
|
|
| Scope-3 emissions include inbound and outbound logistics (where Mahindra pays for transportation), air travel, daily commuting and paper consumption. Here too Mahindra has taken initiatives to counter emissions arising from this scope. One initiative is given below: |
| |
| |
| Transporting more with lesser carbon footprint |
| Automotive Sector, Igatpuri |
| Executives from MLL and AS jointly put into motion an initiative for reducing the transport cost and the resulting carbon emissions per unit of the engines being transported from Igatpuri to Haridwar for assembly. |
|
| The idea was to reduce the total number of trips which could be done by increasing the truck capacity. |
|
| Initially, it took a total of 420 trips of 9 tonne trucks with carrier lengths of 18 ft. to transport 30 units per trip. This was brought down to 247 trips by employing 16 tonne trucks with carrier lengths of 32 ft. which helped transport a total of 51 units in each trip. |
|
This reduced the transport cost per unit from INR 1089 /- to INR 980/-. Overall, in a span of 9 months (May 2009
January 2010), a significant fuel cost saving of INR 1,327,000 (approx). |
| |
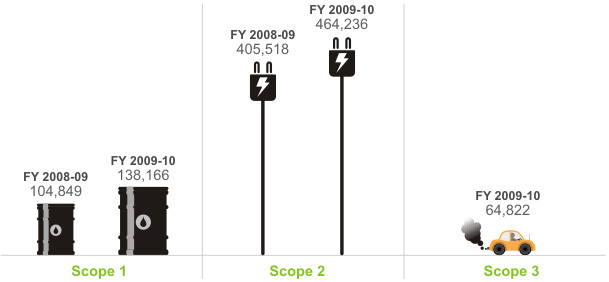
| Absolute GHG Emissions tCO2e |
 |
| |
| |
Note: |
 |
During last two years of sustainability reporting, we have reported on scope 1 and scope 2 GHG emissions of the scoped companies. The increase in absolute GHG emissions as compared to the previous year is due to increase in production/services and inclusion of the Mahindra Two Wheelers Ltd. In the scope (refer table for enhanced production volumes shown earlier in this section) This is likely to happen year on year as we enhance the scope of our reporting. |
|
|
|
As per GRI Guidelines, Direct Emissions arising from sources that are owned or controlled by the reporting organization i.e. the emissions arising from burning fuel for energy within the reporting organizations operational boundaries are considered. This approach was followed for last two reporting years to calculate emissions. |
|
|
|
| However, during the year under review, we initiated a carbon foot print exercise for Scope I, II & III emissions. For this purpose, we have used GHG protocol (WRI/WBCSD guidelines) to calculate the Carbon foot-print As per WBCSD, the Scope 1 emissions arising from stationary combustion sources (Boilers, evaporators, furnaces, flame reactors), Process emissions (Oxidation/ reduction of substrates, impurity removal, byproducts, and catalytic reactions and waste & its disposal have been considered. During this year, the scope 1 emissions are increased due to change in the approach of Direct Emissions and Scope 1 Emission calculations. This is one of the reason for increase in the absolute emissions. |
|
| During the year 2009-10, an inventory of scope 3 emissions has been taken for the first time, hence there are no comparable figures for the year 2008-09. |
| |
| |
| GHG emissions by source |
| |
| Scope 1 - Direct Emissions (tCO2e) |
| Fuel |
2008-09 |
2009-10 |
| Diesel/HSD |
25,924 |
49,486 |
| LDO |
2,676 |
1,958 |
| Petrol |
251 |
301 |
| FO |
47,058 |
50,779 |
| CNG |
6,228 |
2,841 |
| LPG |
19,951 |
25,458 |
| Natural Gas |
2,744 |
7,244 |
| Kerosene |
17 |
0 |
| CO2 |
0 |
98 |
| Acetylene |
0 |
0.44 |
| Total |
104,849 |
138,166 |
|
|
| Scope 2 -
Indirect Emissions (tCO2e)
|
| Fuel |
2008-09 |
2009-10 |
| Electricity purchased |
405,518 |
464,236 |
|
| |
| Scope 3 - Indirect Emissions (tCO2e) |
| Fuel |
2008-09 |
2009-10 |
| Inbound, outbound logistics, daily commuting, air travel, paper consumption |
- |
64,822 |
|
| |
| Note: Kerosene is excluded from the energy generation fuels during year 2009-10 since it is not used for energy generation. From this year onwards two more types of fuels have been identified i.e. CO2 consumption for fire extinguishers and other processes and Acetylene. |
| |
|
|
| |
| |
| |
| GHG Emissions Sector-wise Composition |
| Absolute GHG Emissions tCO2e |
| |
| Sector |
2008-09 |
2009-10 |
| Scope 1 |
Scope 2 |
Scope 1 |
Scope 2 |
Scope 3 |
| AS |
27,073 |
88,578 |
31,316 |
101,470 |
3,593 |
| FES |
12,717 |
51,374 |
18,416 |
59,162 |
28,886 |
| MIL |
135 |
791 |
120 |
991 |
11,650 |
| MTWL |
NIS |
NIS |
1,561 |
4,034 |
1,960 |
SYSTECH
(Except Gears) |
56,376 |
190,166 |
66,305 |
241,823 |
16,365 |
| SYSTECH (Gears) |
671 |
3,288 |
514 |
3,242 |
272 |
| MWC |
236 |
1,986 |
323 |
2,968 |
288 |
| MLDL |
267 |
734 |
441 |
470 |
312 |
| MLL |
2,972 |
DNA |
6,348 |
0 |
65 |
| TECHM |
2,528 |
62,128 |
10,927 |
44,024 |
1300 |
| MHRIL |
1,875 |
4,961 |
1,894 |
4,967 |
130 |
| MMFSL |
0 |
1,513 |
0 |
1,085 |
0 |
| TOTAL |
104,849 |
405,518 |
138,166 |
464,236 |
64,822 |
|
| *- DNA-Data Not Available **- NIS- Not In Scope |
| |
| |
 |
| |
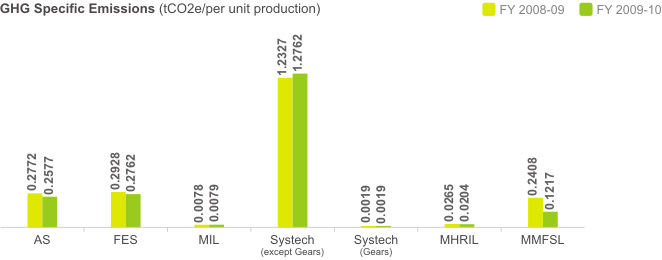
*Unit Production: AS- Per equivalent number of vehicles manufactured; FES- Per equivalent number of tractors manufactured; MIL- Tonnes of production; MTWL - Per equivalent number of vehicles manufactured; Systech
(except Gears) Tonnes of production; Systech (Gears)- Number of gears produced; MHRIL-Room nights booked;
MMFSL-Loan disbursement |
|
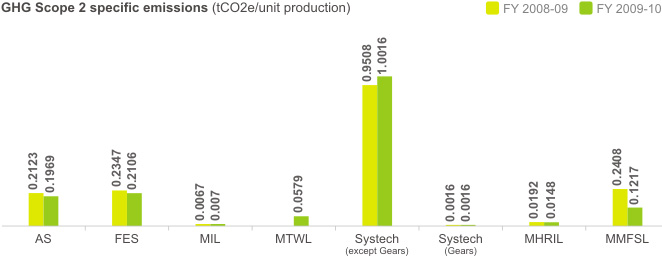
| The increase in the specific GHG emissions of Systech in FY 2009-10 is due to shifting of power purchase from the renewable to non-renewable power since the power purchase agreement with wind power energy provider was not renewed. |
| |
| |
 |
| |
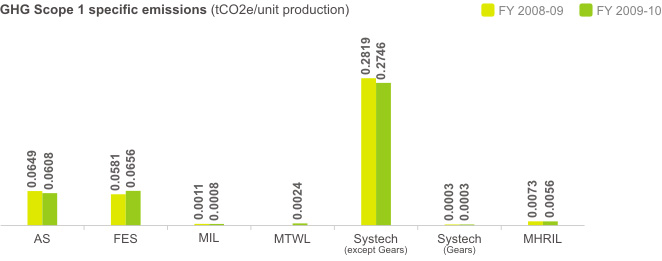
| *Unit Production: AS- Per equivalent number of vehicles manufactured; FES- Per equivalent number of tractors manufactured; MIL- Tonnes of production; MTWL - Per equivalent number of vehicles manufactured; Systech (except Gears) Tonnes of production; Systech (Gears)- Number of gears produced; MHRIL-Room nights booked |
| |
| |
 |
| |
*Unit Production: AS- Per equivalent number of vehicles manufactured; FES- Per equivalent number of tractors manufactured; MIL- Tonnes of production; MTWL - Per equivalent number of vehicles manufactured; Systech (except Gears) Tonnes of production; Systech (Gears)- Number of gears produced; MHRIL-Room nights booked;
MMFSL-Loan disbursement |
|
| Since this is the first year Scope 3 emissions are being tacked, all the sectors could not report all the categories in comparable manner. Hence we are not reporting on specific emissions this year but we plan to include it in future report. |
| |
|
| |
| |
| |
| |
|
|