| |
|
| Environment Performance |
| EMISSIONS |
| At Dr. Reddy's, refining our processes to minimise the impact on the environment ranks high on our list of priorities. Our efforts are focused on being more eco-efficient and reducing our existing carbon footprint. We have made steady progress by tapping emission reduction opportunities in energy intensive areas such as refrigeration & air-conditioning systems, steam generation & distribution, pump optimisation & power management, among others. |
| |
| GHG Acconting |
| Our total GHG emissions for FY 2009-10 were 278,000 metric ton CO2e, representing an 11% rise over FY 2008-09. This increase was on account of the expansion of our FTO 3 and FTO 6 units. The increased fuel usage due to power outages also contributed to the rise in emissions. The silver lining to the emission cloud was that the rate of increase has come down from 17% last year to 11%
this year. |
|
|
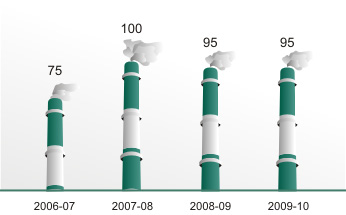
Our specific GHG emissions (Metric Ton CO2e / INR million sales), on the other hand, remained constant at 1% in FY 2009-10, the same as FY 2008-09. |
|
 |
| |
|
|
| |
Specific GHG Emissions |
Unit Sale (mn) I FY 07-08 = 100 |
|
|
| |
Absolute GHG Emissions |
'000 MT CO2e |
|
 |
|
 |
|
| |
| |
| GHG EMISSIONS FACILITY WISE TRENDS |
| |
|
|
|
|
|
| |
CTO-1 |
23,186 |
28,779 |
24% |
|
| |
CTO-2 |
26,207 |
24,847 |
-5% |
|
| |
CTO-3 |
5,399 |
7,853 |
45% |
|
| |
CTO-4 |
6,789 |
5,395 |
-21% |
|
| |
CTO-5 |
70,486 |
69,849 |
-1% |
|
| |
CTO-6 |
42,771 |
51,296 |
20% |
|
| |
FTO-1 |
6,597 |
6,829 |
4% |
|
| |
FTO-2 |
10,678 |
12,220 |
14% |
|
| |
FTO-3 |
27,086 |
35,642 |
32% |
|
| |
FTO-4 |
1,565 |
1,548 |
-1% |
|
| |
FTO-6 |
5,985 |
6,957 |
16% |
|
| |
FTO-7 |
5,422 |
7,787 |
44% |
|
| |
BDC |
7,239 |
8,756 |
21% |
|
| |
DR-CPS |
5,112 |
4,925 |
-4% |
|
| |
IPDO |
5,406 |
5,646 |
4% |
|
| |
Total |
249,928 |
278,329 |
11% |
|
|
|
 |
|
| To view data for SOx, NOx and ODS please refer to Key Performance Indicator Table. |
| |
| |
|
|