|
|
| Environmental Performance |
 |
| Greenhouse Gases |
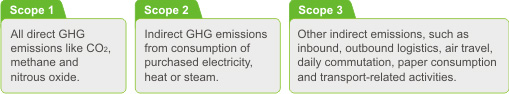
| GHG emissions, both direct and indirect, can be categorised into three broad scopes: |
|
 |
|
Since last year, we report our emissions across all the three
scopes. Last year we also shifted
from reporting direct emissions as
per GRI Guidelines to GHG protocol (WRI/WBCSD guidelines). This
year
we have continued with the
GHG protocol. |
|
 |
|
| |
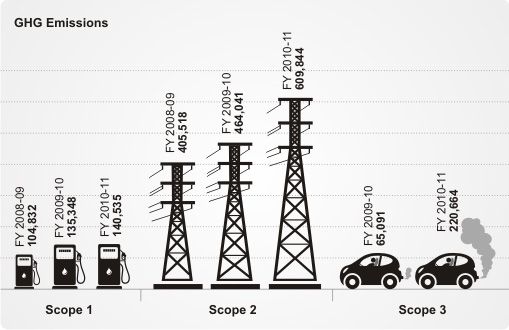
| Mahindra Group - Absolute GHG Emissions |
|
 |
| |
| Note: The increase in absolute GHG emissions as compared to the previous year is due to increase in production/services and inclusion of MVML, MSat, AM-MSB in the reporting scope (refer table for enhanced production volumes shown earlier in this section). This is likely to happen year on year as we enhance the scope of our reporting. As a continual improvement, sectors have devised processes to capture Scope 3 consumption in detail. This has resulted in the increase of Scope emissions compared to previous year. |
| |
| |
| GHG Emissions segmented by source |
| in tCO2e |
| |
|
|
|
| Scope 1 - Direct Emissions |
|
|
|
| Diesel/HSD |
25,924 |
46,766 |
56,920 |
| LDO |
2,676 |
1,958 |
3,358 |
| Petrol |
251 |
301 |
244 |
| FO |
47,058 |
50,779 |
59,838 |
| LPG |
19,951 |
25,458 |
12,631 |
| Natural Gas+ CNG |
8,972 |
10,085 |
7,544 |
| Total |
104,832 |
135,348 |
140,535 |
| Scope 2 - Indirect Emissions |
|
|
|
| Electricity purchased |
405,518 |
464,041 |
609,844 |
| Scope 3 - Indirect Emissions |
|
|
|
Total (Inbound logistics, Outbound logistics, Daily commutation,
Air Travel, Paper consumption) |
NIS |
65,091 |
220,664 |
|
| |
| Note: NIS-Not in Scope.
The emissions arising from CO2 fire extinguishers and Acetylene are insignificant and hence excluded from the reporting scope 2009-10 onwards. Kerosene is excluded since it is not used for energy generation. |
The emission of petrol and LPG has come down due to less utilisation. The sectors use natural
gas, LPG and diesel for their Scope 1 emissions. The use of fuel mix depends upon the
availability of the fuel. |
| |
| |
| GHG Emissions Sector-wise Composition |
 |
|
| in tCO2e |
| |
Year |
2008-09 |
2009-10 |
2010-11 |
 |
Scope |
Scope 1 |
Scope 2 |
Scope 1 |
Scope 2 |
Scope 3 |
Scope 1 |
Scope 2 |
Scope 3 |
| AD |
27,073 |
88,578 |
31,259 |
101,470 |
3,593 |
23,267 |
106,998 |
23,440 |
| FD |
12,717 |
51,374 |
18,416 |
59,162 |
28,886 |
16,788 |
71,492 |
54,373 |
Systech
(Except Gears) |
56,359 |
190,166 |
66,264 |
241,823 |
16,365 |
71,092 |
283,138 |
48,455 |
| Systech (Gears) |
671 |
3,288 |
514 |
3,242 |
272 |
294 |
3265 |
2,717 |
| MIL |
135 |
791 |
120 |
991 |
11,920 |
197 |
1,293 |
22,314 |
| MTWL |
NIS |
NIS |
1,561 |
4,034 |
1,960 |
2,978 |
5,741 |
4,605 |
 |
MWC |
236 |
1,986 |
323 |
2,968 |
288 |
323 |
4,683 |
50 |
| MLDL |
267 |
734 |
441 |
470 |
312 |
337 |
643 |
522 |
| MLL |
2,972 |
DNA |
3,629 |
DNA |
65 |
324 |
311 |
46 |
| MHRIL |
1,875 |
4,961 |
1,894 |
4,967 |
130 |
2,148 |
8,985 |
257 |
| MMFSL |
DNA |
1,513 |
DNA |
890 |
DNA |
7 |
928 |
477 |
| Tech M |
2,528 |
62,128 |
10,927 |
44,024 |
1,300 |
13,768 |
50,883 |
22,172 |
 |
MVML |
NIS |
NIS |
NIS |
NIS |
NIS |
4,869 |
22,773 |
227 |
| MSat |
NIS |
NIS |
NIS |
NIS |
NIS |
4,110 |
48,075 |
26,196 |
| AM-MSB |
NIS |
NIS |
NIS |
NIS |
NIS |
33 |
636 |
14,813 |
| |
Total |
104,833 |
405,519 |
135,348 |
464,041 |
65,091 |
140,535 |
609,844 |
220,664 |
|
|
|
Note: NIS-Not in Scope, DNA-Data Not Available |
| |
| |
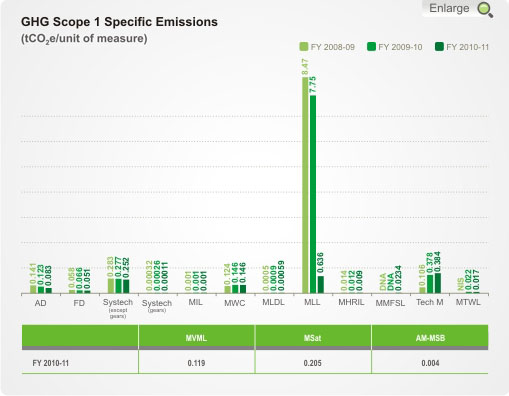
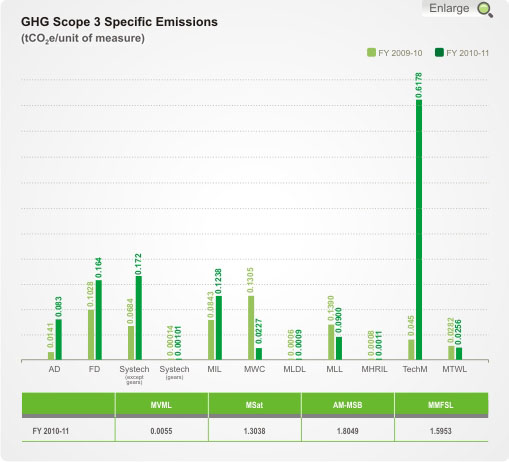
| Specific Emissions Highlights |
| |
1. AD, FD, Systech, MTWL, MLDL, MLL, MMFSL and Tech M have all recorded significant reduction in their specific combined Scope1 & Scope 2 emissions compared to
previous year. |
|
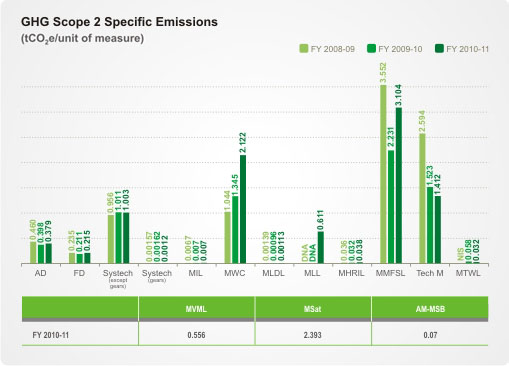
| 2. MIL, MWC, MHRIL, MMFSL are the four sectors to have recorded an increase in their combined specific Scope 1 & Scope 2 emissions compared to previous year. The sectors have been alerted and a cause analysis will soon be instituted to arrest this increase. |
| |
| Total Specific Emissions |
in tCO2e/unit of measure |
|
| |
Sector |
2008-09 |
2009-10 |
2010-11 |
% reduction in
2010-11 over
previous year |
| |
Scope |
Scope 1+2 |
Scope 1+2 |
Scope 1+2 |
Scope 1+2 |
 |
AD |
0.60 |
0.52 |
0.46 |
12 |
| FD |
0.29 |
0.28 |
0.266 |
5 |
| Systech (Except Gears) |
1.24 |
1.29 |
1.26 |
2 |
| Systech (Gears) |
0.0019 |
0.0019 |
0.0013 |
32 |
| MIL |
0.0078 |
0.0079 |
0.0082 |
-4 |
| MTWL |
NIS |
0.08 |
0.049 |
39 |
 |
MWC |
1.17 |
1.49 |
2.27 |
-52 |
| MLDL |
0.00189 |
0.00187 |
0.00172 |
8 |
| MLL |
8.47 |
7.75 |
1.25 |
84 |
| MHRIL |
0.050 |
0.044 |
0.047 |
-7 |
| MMFSL |
3.552 |
2.231 |
3.127 |
-40 |
| Tech M |
2.70 |
1.90 |
1.80 |
5 |
|
| |
Scope 1+2 specific GHG emission values for businesses covered for the first time
in this report i.e MVML, MSat and AM-MSB are 0.68, 2.60 & 0.08 tCO2e/unit of measure respectively. |
|
|
All businesses have devised methodologies to capture
and report Scope 3 emissions this year. For details, view the full report. |
|
| The reason for the increase in specific energy of sectors like MWC & MMFSL is also applicable for the increase in GHG emissions. |
|
 |
| |
 |
| |
 |
| |
| |
 |
| |
| |
| |
| |
|
|
|