|
|
| Economic Performance |
 |
| |
The Gross Revenues and Other Income for the year ended 31st March 2011 grew by 17.5%
to INR 397,087 million (USD 8.7 billion) from INR 337,901 million (USD 7.4 billion) last year. The consolidated group profit for the year after exceptional items, prior-period adjustments and tax and after deducting minority interests is INR 30,797 million (USD 677.2 million) as compared to INR 24,786 million (USD 545 million) earned in the previous year - a growth
of 24.2%. |
|
|
This impressive bottom-line growth is a manifestation of our rigorous cost restructuring exercises, efficiency improvements, value engineering, optimisation of plant capacity utilisation and commitment to cost competitiveness in all areas. |
|
| |
|
|
|
|
| Net Revenues |
231,028.3 |
297,870.5
|
433,138.8 |
|
| PAT |
21,315.5 |
32,100.70 |
38,172.83 |
|
| Foreign exchange earnings* |
6,912.50 |
7,614.4 |
10,999 |
|
| Amount spent on R&D# |
5,156.50 |
6,895.6 |
8,527.5 |
|
|
|
| *For M&M Limited only. The values of revenues, Net Turnover and Profit After Tax are on standalone basis and before elimination of intergroup transactions |
|
| #The R&D investment for M&M Limited and MTWL are 2.85% & 19.80% of their turnover respectively for the reporting year. • FY 2008-09 data is for M&M Ltd. • FY 2009-10 and FY 2010-11 data is for M&M Ltd. and MTWL. |
|
| Note: The above comparison should be viewed in the light of the fact that MVML & MSat have been added to the scope in FY 2010-11. |
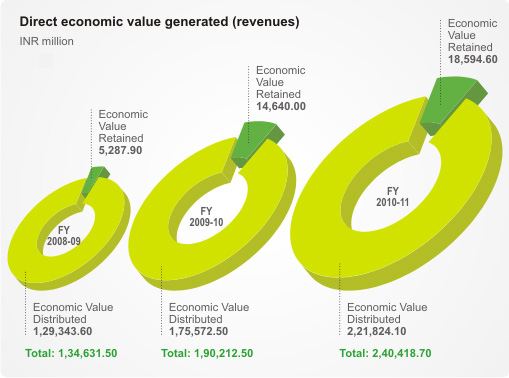
| Economic Value Generated |
| We continued to generate higher economic value on a year on year basis and distributed 26% higher value across our spectrum of diverse stakeholders. |
|
 |
|
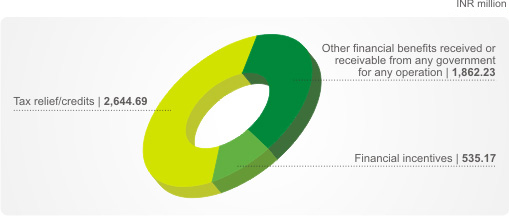
| Financial Assistance Received from The Government |
 |
|
|
|